Firstly a recap ... there are many system development methods advertised. (Ignoring the object-oriented paradigm) these methods tend to focus on one of 3 possible views of system data. Either the 'functional' view of the system by examining the various functions undertaken by the system and the flow of information between those functions (usually diagrammatically represented in some form of Data Flow Diagram). Or the 'structural' view of the system by examining the structure of the data and the relationships between the various items of data (usually diagrammatically represented in the form of an Entity-Relationship diagram - known as a Logical Data Structure in SSADM). In the case of ER modelling, data normalisation, also known as Relational Data Analysis, is usually performed on the various entity attributes to reduce the functional dependency between entities. The third view examines the system from a time-based perspective, considering the sequence in which events occur.
Whilst most methods focus on one of these views, SSADM incorporates or 3 perspectives. This lecture introduces the third perspective 'time'. In a subsequent lecture we will examine how we combine these three views into a set of complementary models in which any conflict has been resolved. The philosophy upon which SSADM is based suggests that by examining a proposed system from all three perspectives there is less risk of missing important features of the system under investigation.
ELHs provide us with the third view of the system, the dynamic sequence or time-based view. It shows the processing cycle of an entity from creation to deletion. It models all possible changes to the values of the attributes (or data items) of the entity during its life and the sequence in which the updates take place.
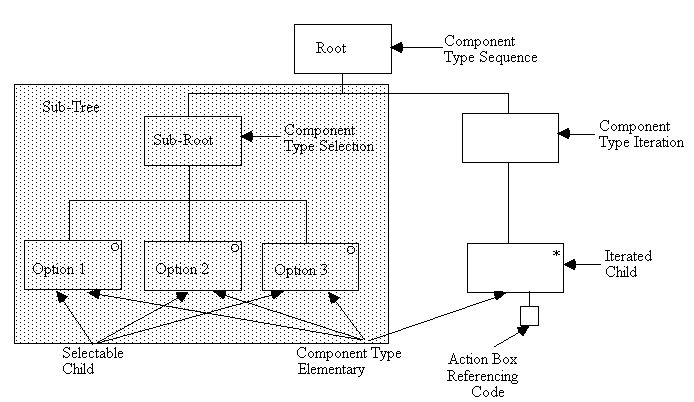
To diagrammatically represent an ELH we use 'structure diagram notation', also known as Jackson diagrams. These diagrams are mainly used with the Jackson Structured Programming (JSP) and Jackson System Development (JSD) methodologies as developed by Michael Jackson (in the computing world he is the Michael Jackson !). JSP is used for developing single programs whilst JSD is used for developing a suite of communicating programs. An example is given below:

Figure 1: Nomenclature of JSP/JSD
The structure diagram consists of three main simple constructs: 'sequence', 'selection' and 'iteration'.
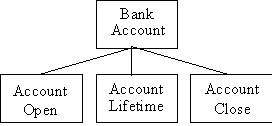
Figure 2: Sequence Construct
The order of the boxes indicates sequence. Events must occur in the sequence account opened, account life (the transactions which occur) and finally account closed.
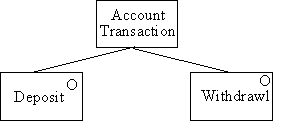
Figure 3: Selection Construct
The 'o' in the box indicates alternatives. A transaction is either a deposit or a withdrawal.

Figure 4: Null Selection Construct
A null box is used when a no selection option is required.

Figure 5: Iteration Construct
The asterisk represents iteration. Transactions can occur in succession. Note that an iteration of zero is allowed, so this construct can indicate that a state may or may not occur.
The constructs are grouped together into tree-like structures, the single box at the top indicating the entity:
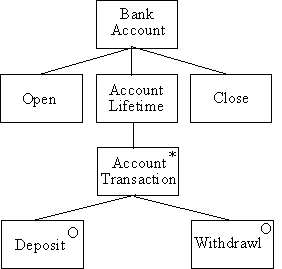
Figure 6: The Full Diagram for Bank Account
The meaning of the above structure diagram is that, given any bank account, the first event is the 'open' event, the 'account lifetime events can only occur after an 'open' event and before a 'close' event. Similarly, a 'close' event can only occur after an 'open' event and the 'accounts lifetime'. From the structure chart we can also observe that 'account lifetime' is also decomposed in to an iteration of 'account transactions'. Strictly, the iteration can occur zero or more times therefore no 'account transaction' is required to take place between the 'Bank Account' being 'opened' and 'closed'. Finally, the 'account transactions' can be one of two events: 'deposit', or 'withdrawal'. There is no time-ordering to selectable components so in this representation a 'withdrawal' could precede a 'deposit'.
Note that an event can affect two entities e.g. the event account opened would also be on the ELH for the entity customer.
Also note that the different constructs are not mixed on the same level e.g. the box Account Lifetime has been introduced so that the iteration transaction is not on the same level as the sequence boxes. Intermediate boxes have no significance other than to show sequence.
In SSADM the entities will have been defined in the Logical Data Structure (also known as the Entity Relationship Diagram). In other methodologies the definition is more vague: 'something of interest in the problem domain', ' a thing about which information is held'. An entity can be either physical or conceptual i.e. a person or a project.
An event is something that happens in the real world to cause a change of state to the database. The 'trigger' that causes the event to occur may be as a result of three things:
i) Externally generated, such as a training officer placing bookings for staff to attend a course;
ii) Internally generated, such as course numbers falling below a critical level, so canceling the running of a course;
iii) Time-based, such as the automatic rising of invoices at a set time of the month.
In SSADM, the lowest level of the DFD should show us the events that will constitute the ELH. However, different naming conventions should be employed as more than one trigger may be required to activate the DFD process, each trigger being a different event. It therefore follows, that the same event can occur in more than one ELH.
The ELH maps out the events that can impact upon an entity in the sequence in which they will occur. However, whilst most events can be modelled in such a sequence, some will happen at random. For example, a customer can change address whilst orders are still being processed: the customer record will need amending & so will the order record to show the new delivery address. Therefore, some updates to an entities attributes can occur at any point in the life history, the timing of such events can not be predicted and so cannot be placed in any particular sequence on the ELH diagram. Similarly, when such events do occur, they will not impact on the main sequence of events in the life history. These sorts of events are frequently concerned with the alteration of reference information to the entity.
The structure we use to record this is a 'parallel life'. The construct is used when the sequence of events is not predictable or can occur concurrently. The notation to show a parallel life is the double horizontal bar (see below). There are no limits to the number of parallel lives allowed.
Consider the following example
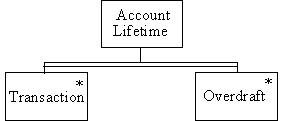
Figure 7: Parallel Life Construct
The parallel life indicates that transactions and overdrafts can occur at the same time..
In the example below an account may be suspended and at some later point re-opened in which case it continues its account life. Note the use of the null selection - it is not an inevitable part of Bank Account that the account will be suspended.
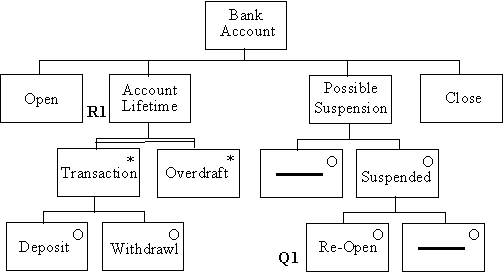
Figure 8: Illustration of the Use of Quits and Resumes
The Q1 indicates the points at which the diagram is left and the R1 where it is re-joined. There may be more than one quit and resume on a diagram hence the number following the letter.
If it is possible to quit from anywhere on a diagram a separate diagram can be created for the resume section.
In order to create Entity Life Histories SSADM suggests the following activities:
A grid is created. Down the side of the grid we list all the entities identified during the creation of the entity-relationship diagram. Along the top of the grid we list all the events identified. An event is an action within a process which provides an update to a data store on the lowest level of the logical DFDs. Consider the following partial entity/event matrix for the entities 'Fossil'.
               Catalogue      Loaned      Returned      Returned       Lost
               Addition                    Damaged    Not Damaged


   Fossil          1            M             M            M             1

    etc.
The entity/event matrix shows how many times an event can occur (1, many or none). From this the ELH can be drawn.
We can now draw the ELH. Start with details entities from the LDS. Use constructs to represent the life of the entity.
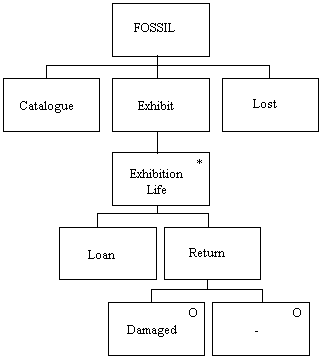
Figure 9: ELH Derived from the Entity/Event Matrix of Figure 8
Consider the following:
interaction between entities, particularly their disconnection and reconnection;
abnormal death events (use separate Q and R);
reversions i.e. resumption of normal life;
random events using parallel life structure.
The end leaf of an entity represents the effect or action (see figure 1). The operations provide a way of describing these effects. The logical operations which should be documented are:
Store <attribute>, keys, remaining attributes, <attribute> using <expression>;
Replace <attribute>, <attribute> by <expression>;
Tie to <entity> (establish relationship with master);
Cut from <entity> (remove relationship with master);
Gain <entity> (establish relationship with detail);
Lose <entity> (remove relationship with detail).
The addition of operations can be illustrated by the following example:
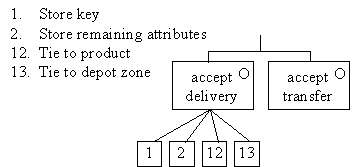
Figure 10: Illustration of Addition of Operations
In the logical design stage of SSADM state indicators are added to ELHs.
By adding state indicators to ELHs we can see which event occurred last and which event can occur. A state indicator is a numeric value which identifies the completion of an event.
The following information is added to the end leaves of the ELH:
valid previous values is a list of values a state indicator can have for the event to be allowed;
value a state indicator is set to by the event.
State indicators are added by:
first adding set to values;
then considering the sequence of events to determine the valid previous values.
An example is shown below:
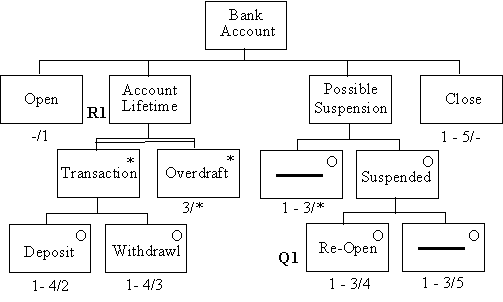
Figure 11: Illustration of the Addition of State Indicators
For more information on state indicators read the Goodland and Slater recommend reading (pp.329-341).
In summary ELHs: